Thanks to NCTCOG/Dallas-Fort Worth Clean Cities’s registration data and maps page, I’ve been tracking EV adoption over time. Today, I dove a little deeper to see how that adoption rate changes over time. Think of it in calculus terms. If the first derivative of a function is slope and the second derivative is instantaneous rate of change of the slope, then we should be able to tell where we are in the S adoption curve.
Today, I charted EV adoption two ways:
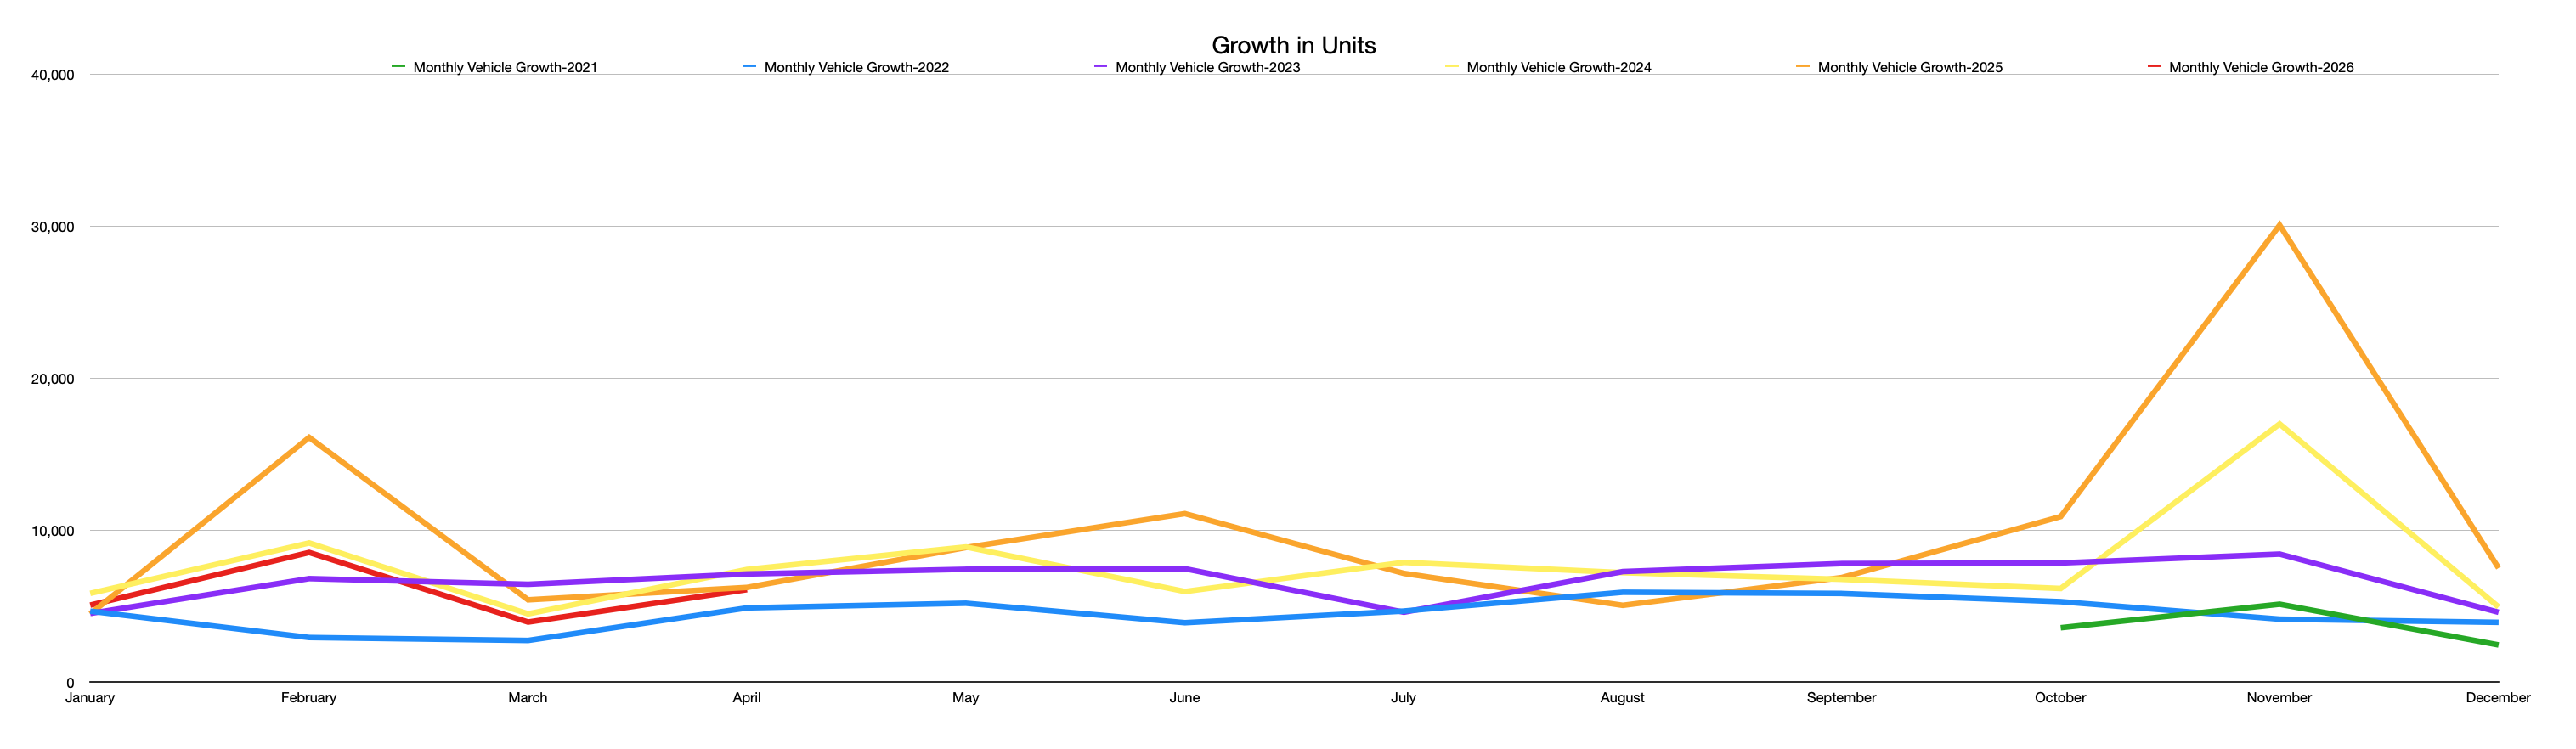
- Year-over-year monthly growth in units on the road
This method shows that the number of units registered in Texas has been steadily increasing every single year, until this year (in red). Perhaps concerns about the war and the economy are finally slowing EV adoption. The years (organized from earliest to most recent are arranged by color (green, blue, purple, yellow, orange, red). The chart below, when viewed young those colors as a guide, show those curves increasing in the order of time/color. In other words, until this year, Texans was registering more and more EVs. Another trend seems to be showing up: EV adoption seems to spike, in more recent years, in February, June and November. This is based on less than five years’ data, so the spikes may be an anomaly. The 30,076 bought in November of 2025 though was one helluva spike.
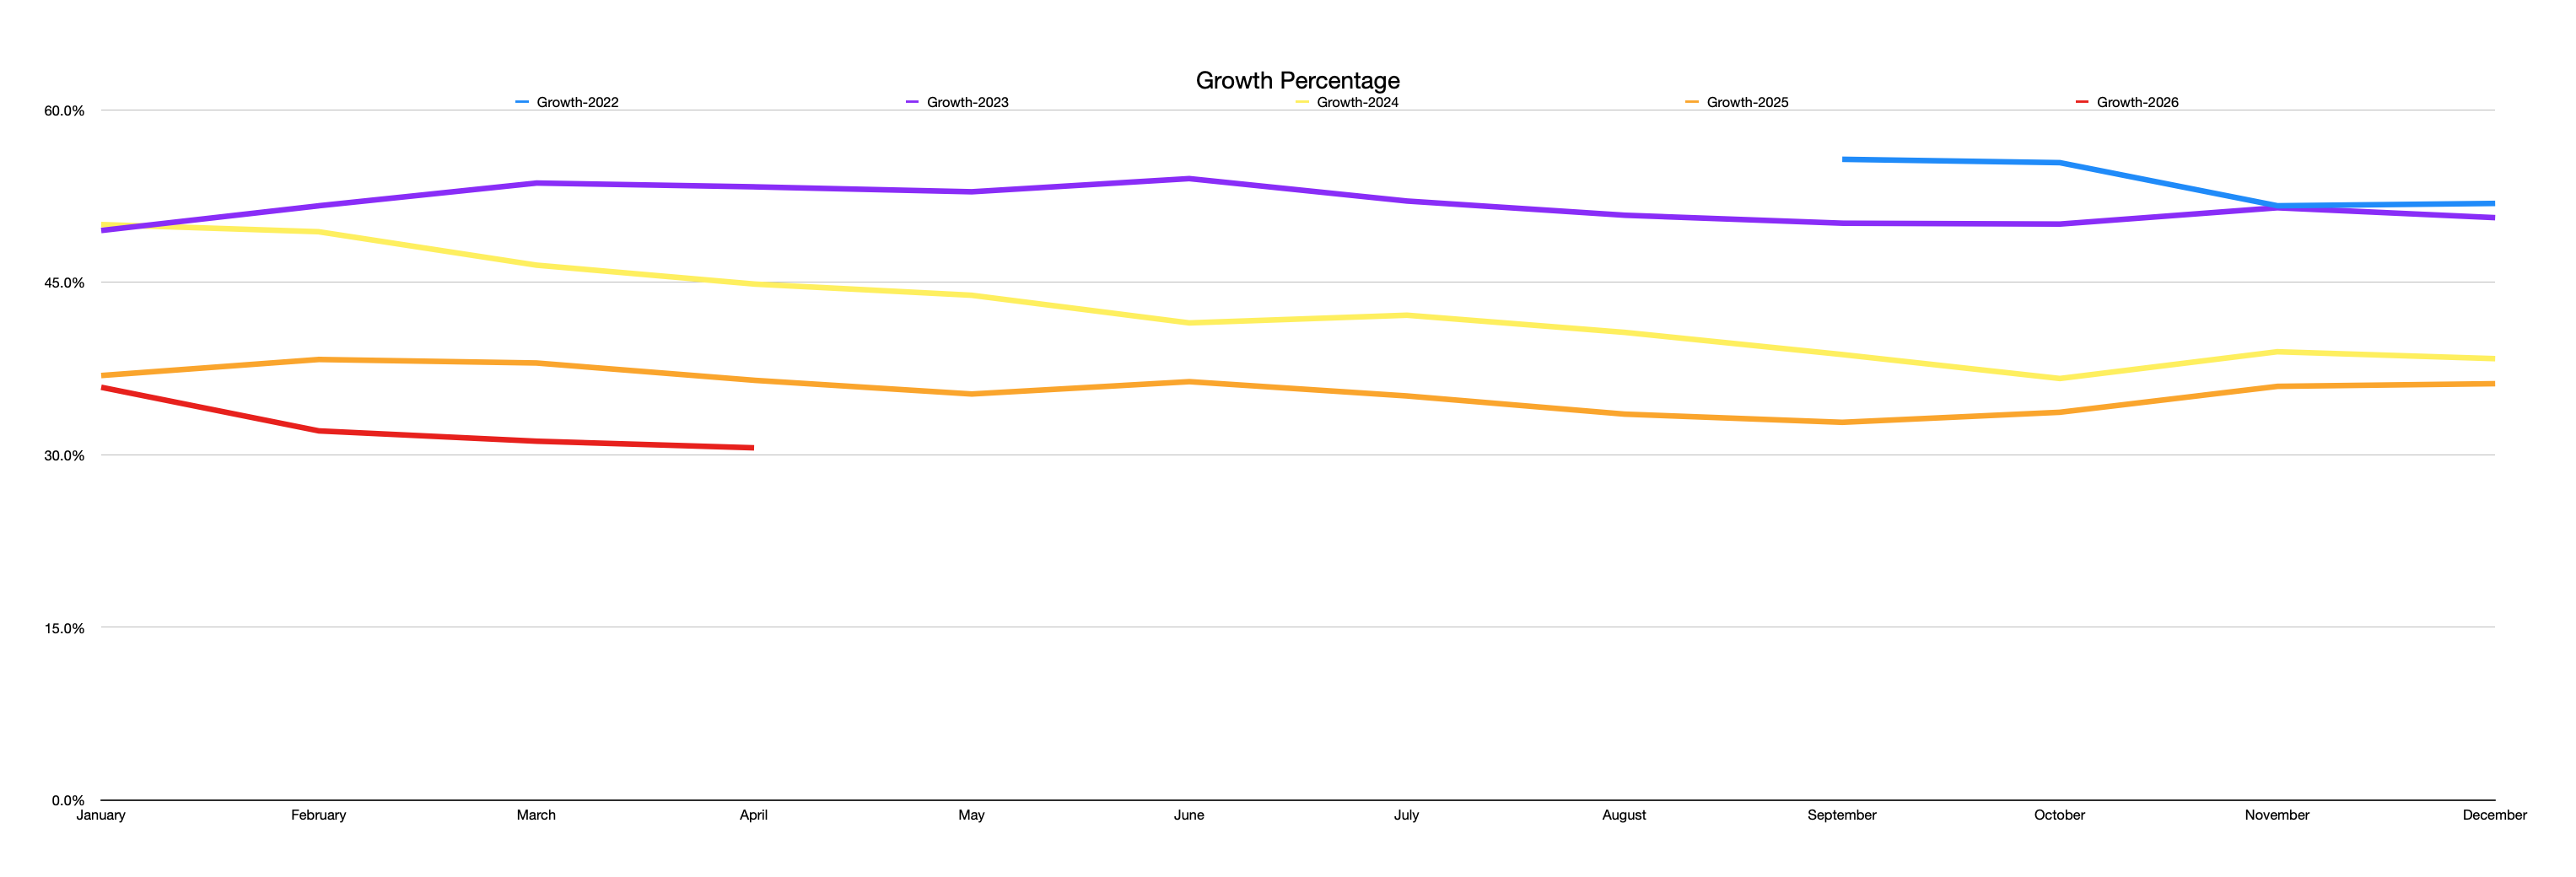
- Year-over-year monthly growth as a percentage of the EVs on the road.
However, when we examine the increase in percentages, we see the opposite. The most recent year (red) is at the bottom of year-over-year percentage increase and the colors are very distinctly organized by the color order mentioned earlier, with the earliest year (blue) at the top. This is to be expected, as the number of units needed to increase the Texas fleet by 1% is much higher today because Texas has 474,862 EVs, versus only 93,499 in September of 2021.
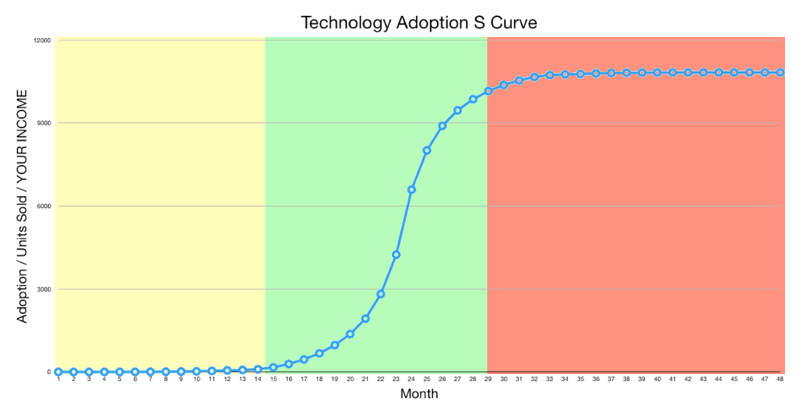
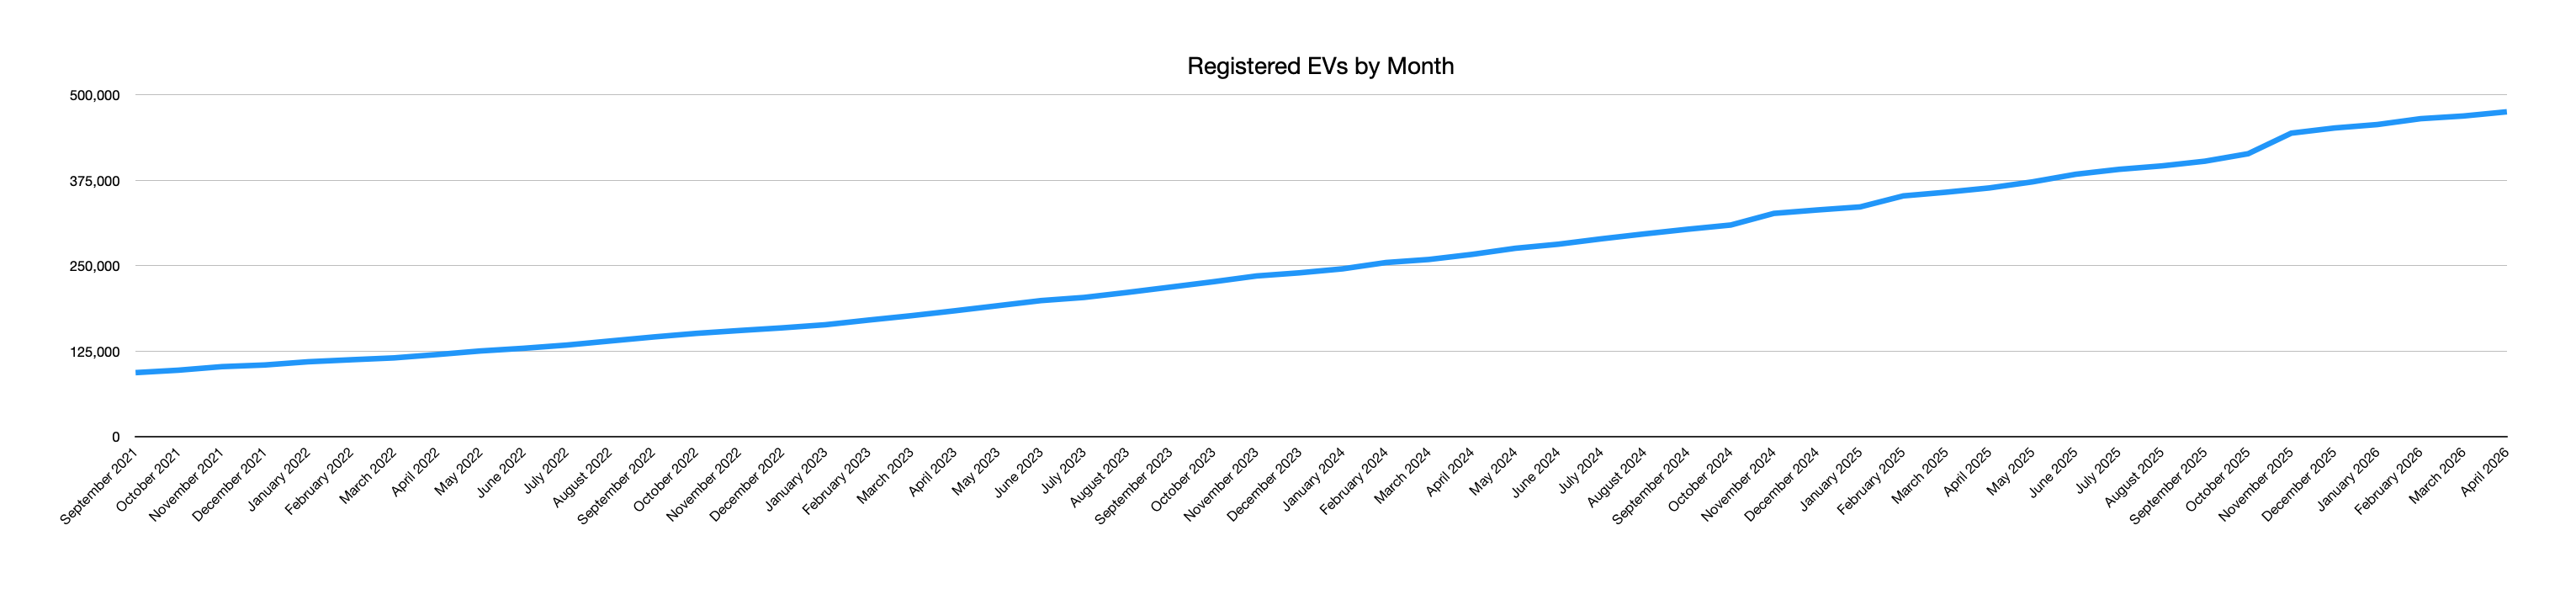
This is an interesting conundrum. Where are we on the S curve? As the chart below shows, cumulative growth of EVs registered in Texas continues to rise. This takes into account EVs that have been totaled, moved out of state or moved into the state.
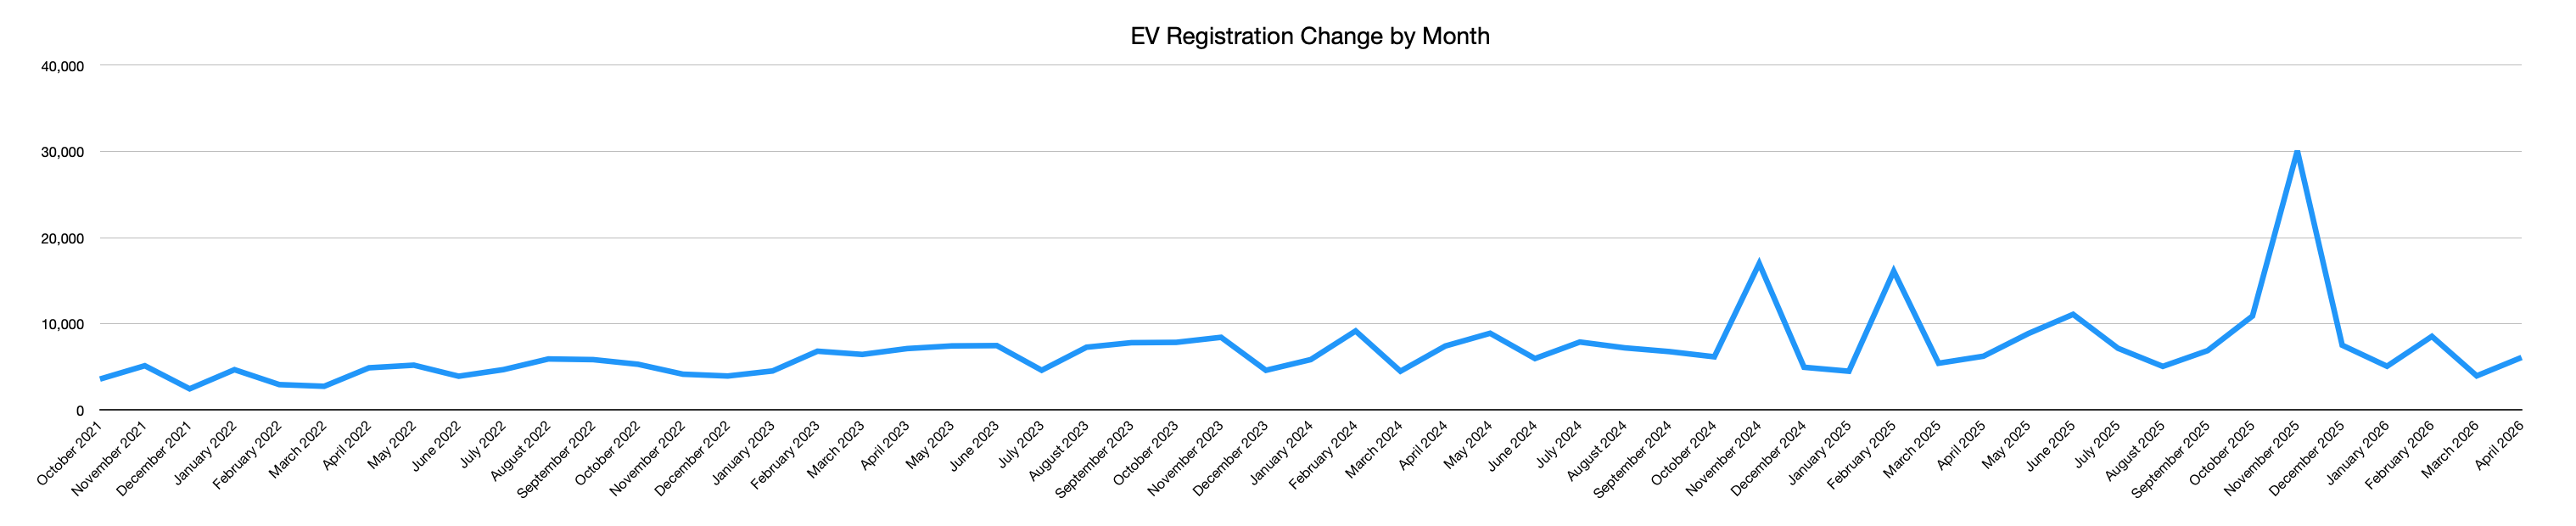
The chart below shows how much EV registration increased in units in a particular month. Nothing really consistent here, except that the trend is growth. Based on this, I think Texas is still at the early stages of the S curve of adoption.
As of May 5, 2026, Texas had 483,050 EVs registered. When will we hit 500,000? What’s your predicted date for this milestone?
My prediction is July 31, 2026.