New vehicle window stickers have an EPA section. It’s where you usually look for the MPG or “Miles Per Gallon” rating of a vehicle. Since electric vehicles use electricity as “fuel,” how do you make that comparison? Well, the EPA came to the rescue by creating MPGe or “Miles Per Gallon equivalent.”
Unfortunately, it’s pretty useless.
What you really want to know is this burning question:
“How far can I drive any EV or ICE vehicle on one dollar?”
Remember when the war in Ukraine started? The price of gasoline went up to a national average of over $5.00 per gallon. In Texas, most of us can select our electricity provider and lock in a rate for years. I locked my rate in for three years, when it was relatively low in price, so wars, hurricanes, etc. have no impact on the cost of my EV’s “fuel.”
That’s a huge advantage during times of instability.
Those fluctuations make it impossible to put the comparative cost of driving an electric vehicle down the road on a window sticker, because that cost is always changing. Window stickers can’t react to changes in both fuel prices (electricity and gasoline). Those price fluctuations make MPGe a moving target, but I have a solution for you (if you charge at home or know the cost per kWh at public chargers in your area)*. It’s an MP$ (Miles Per Dollar) calculator that you can load into your smartphone, tablet, laptop or desktop computer. It’s a very simple spreadsheet and is available in Microsoft Excel or Apple Numbers format.
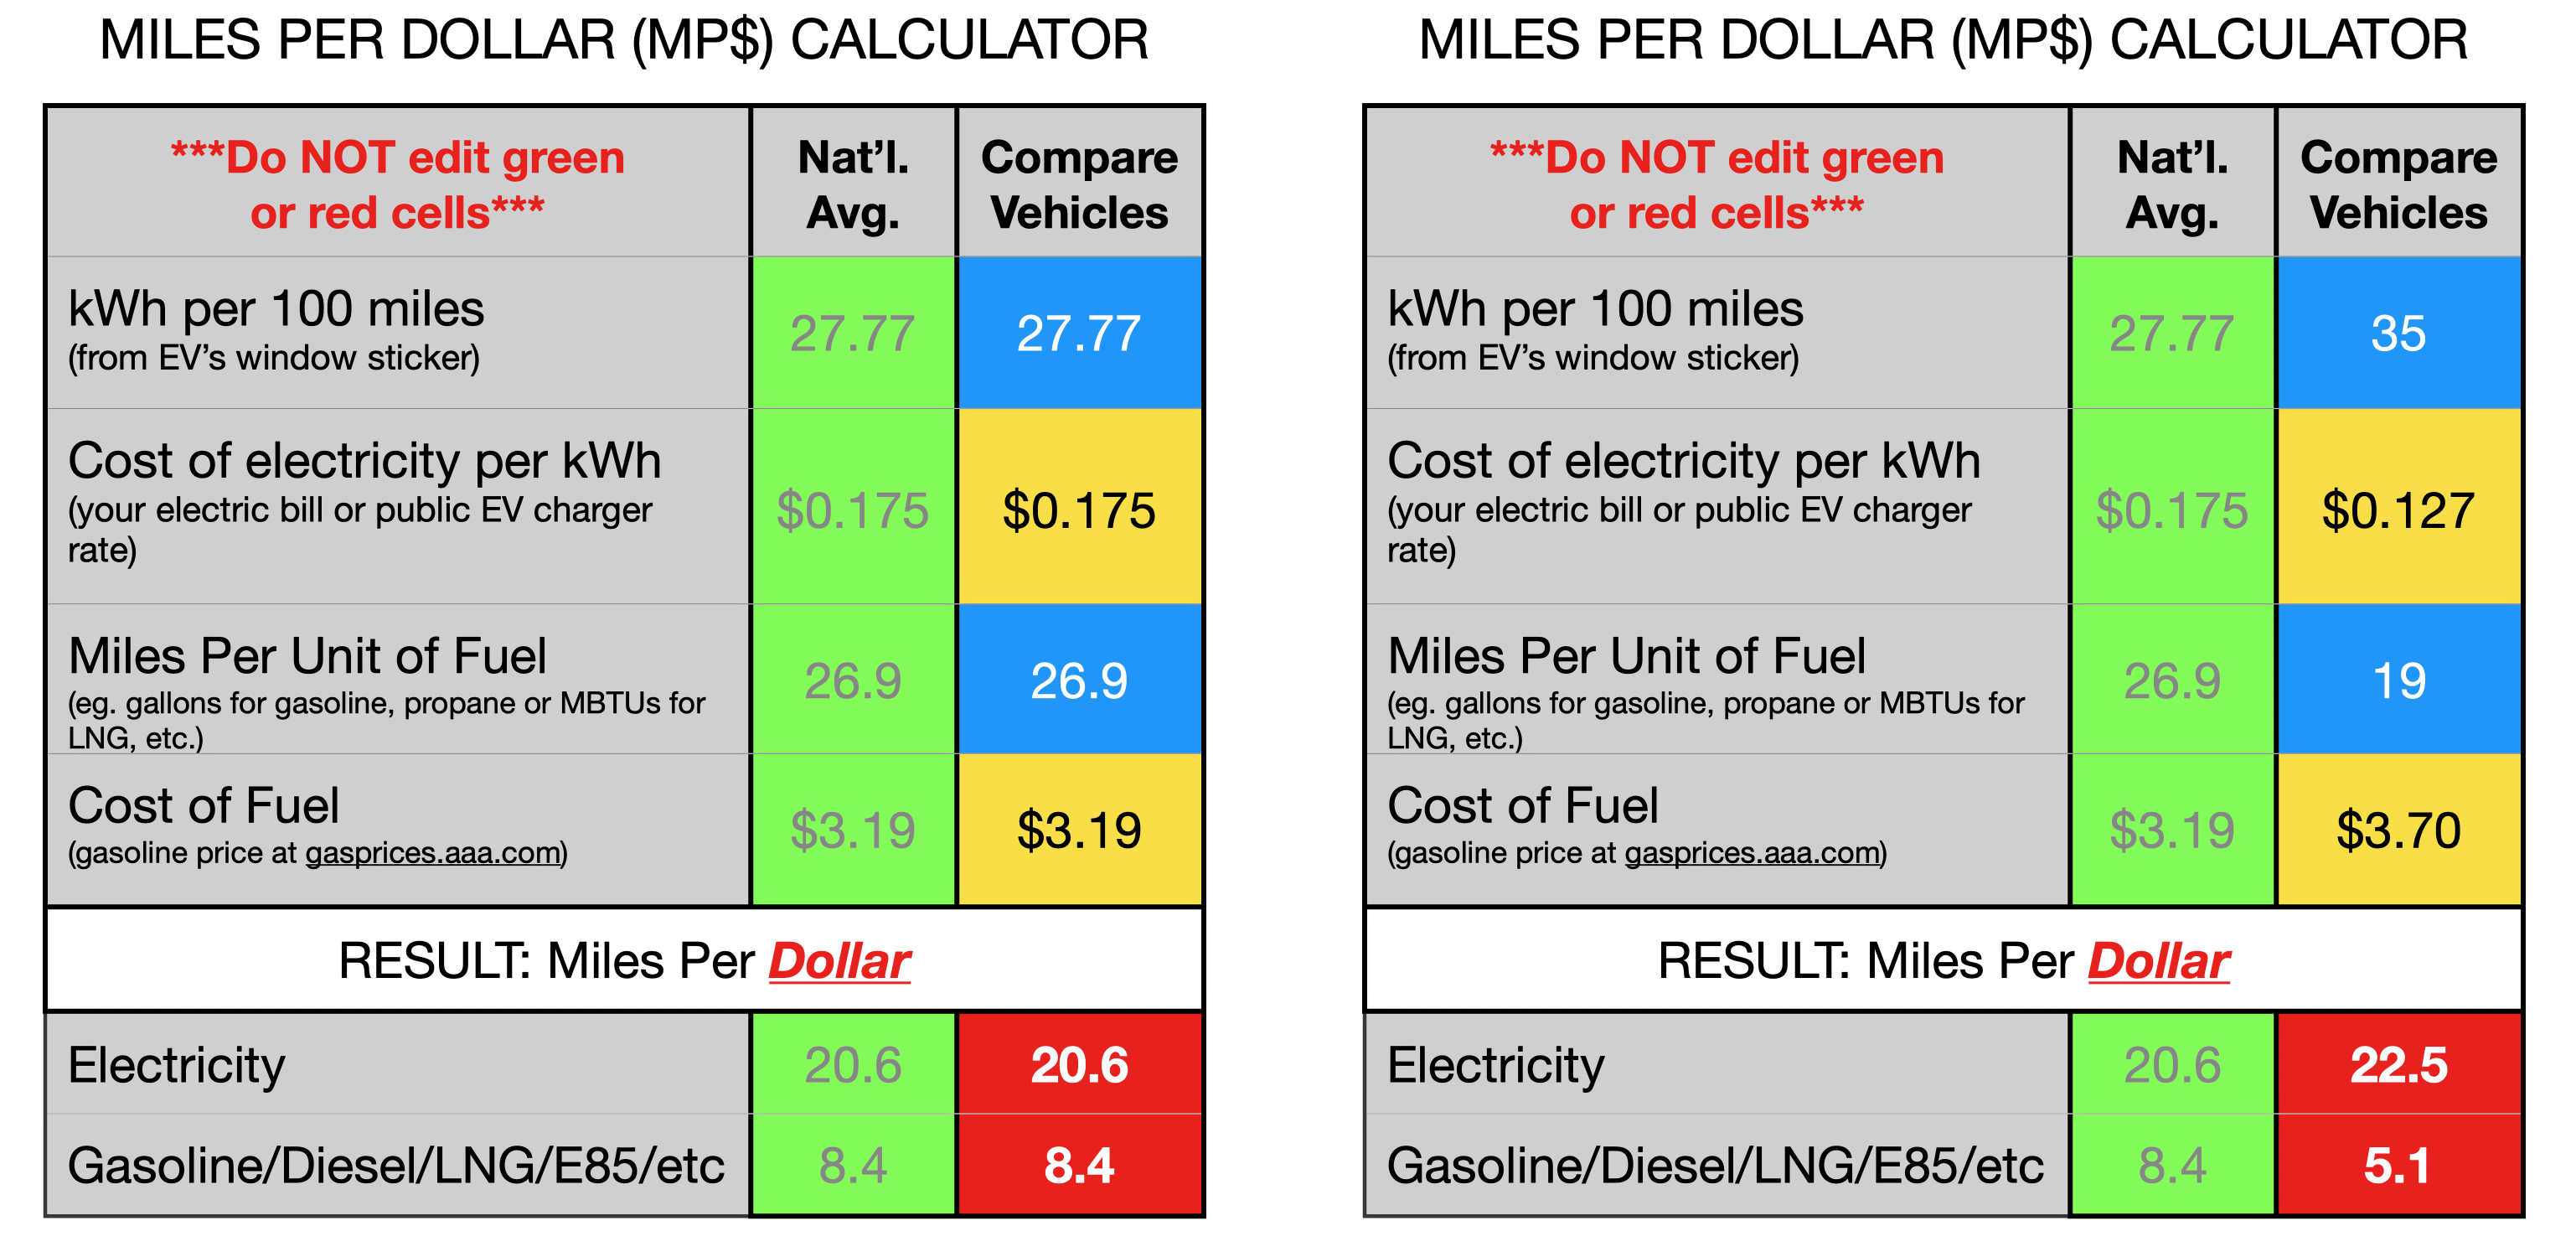
Here’s two images of what the spreadsheet looks like. There are four numbers you provide:
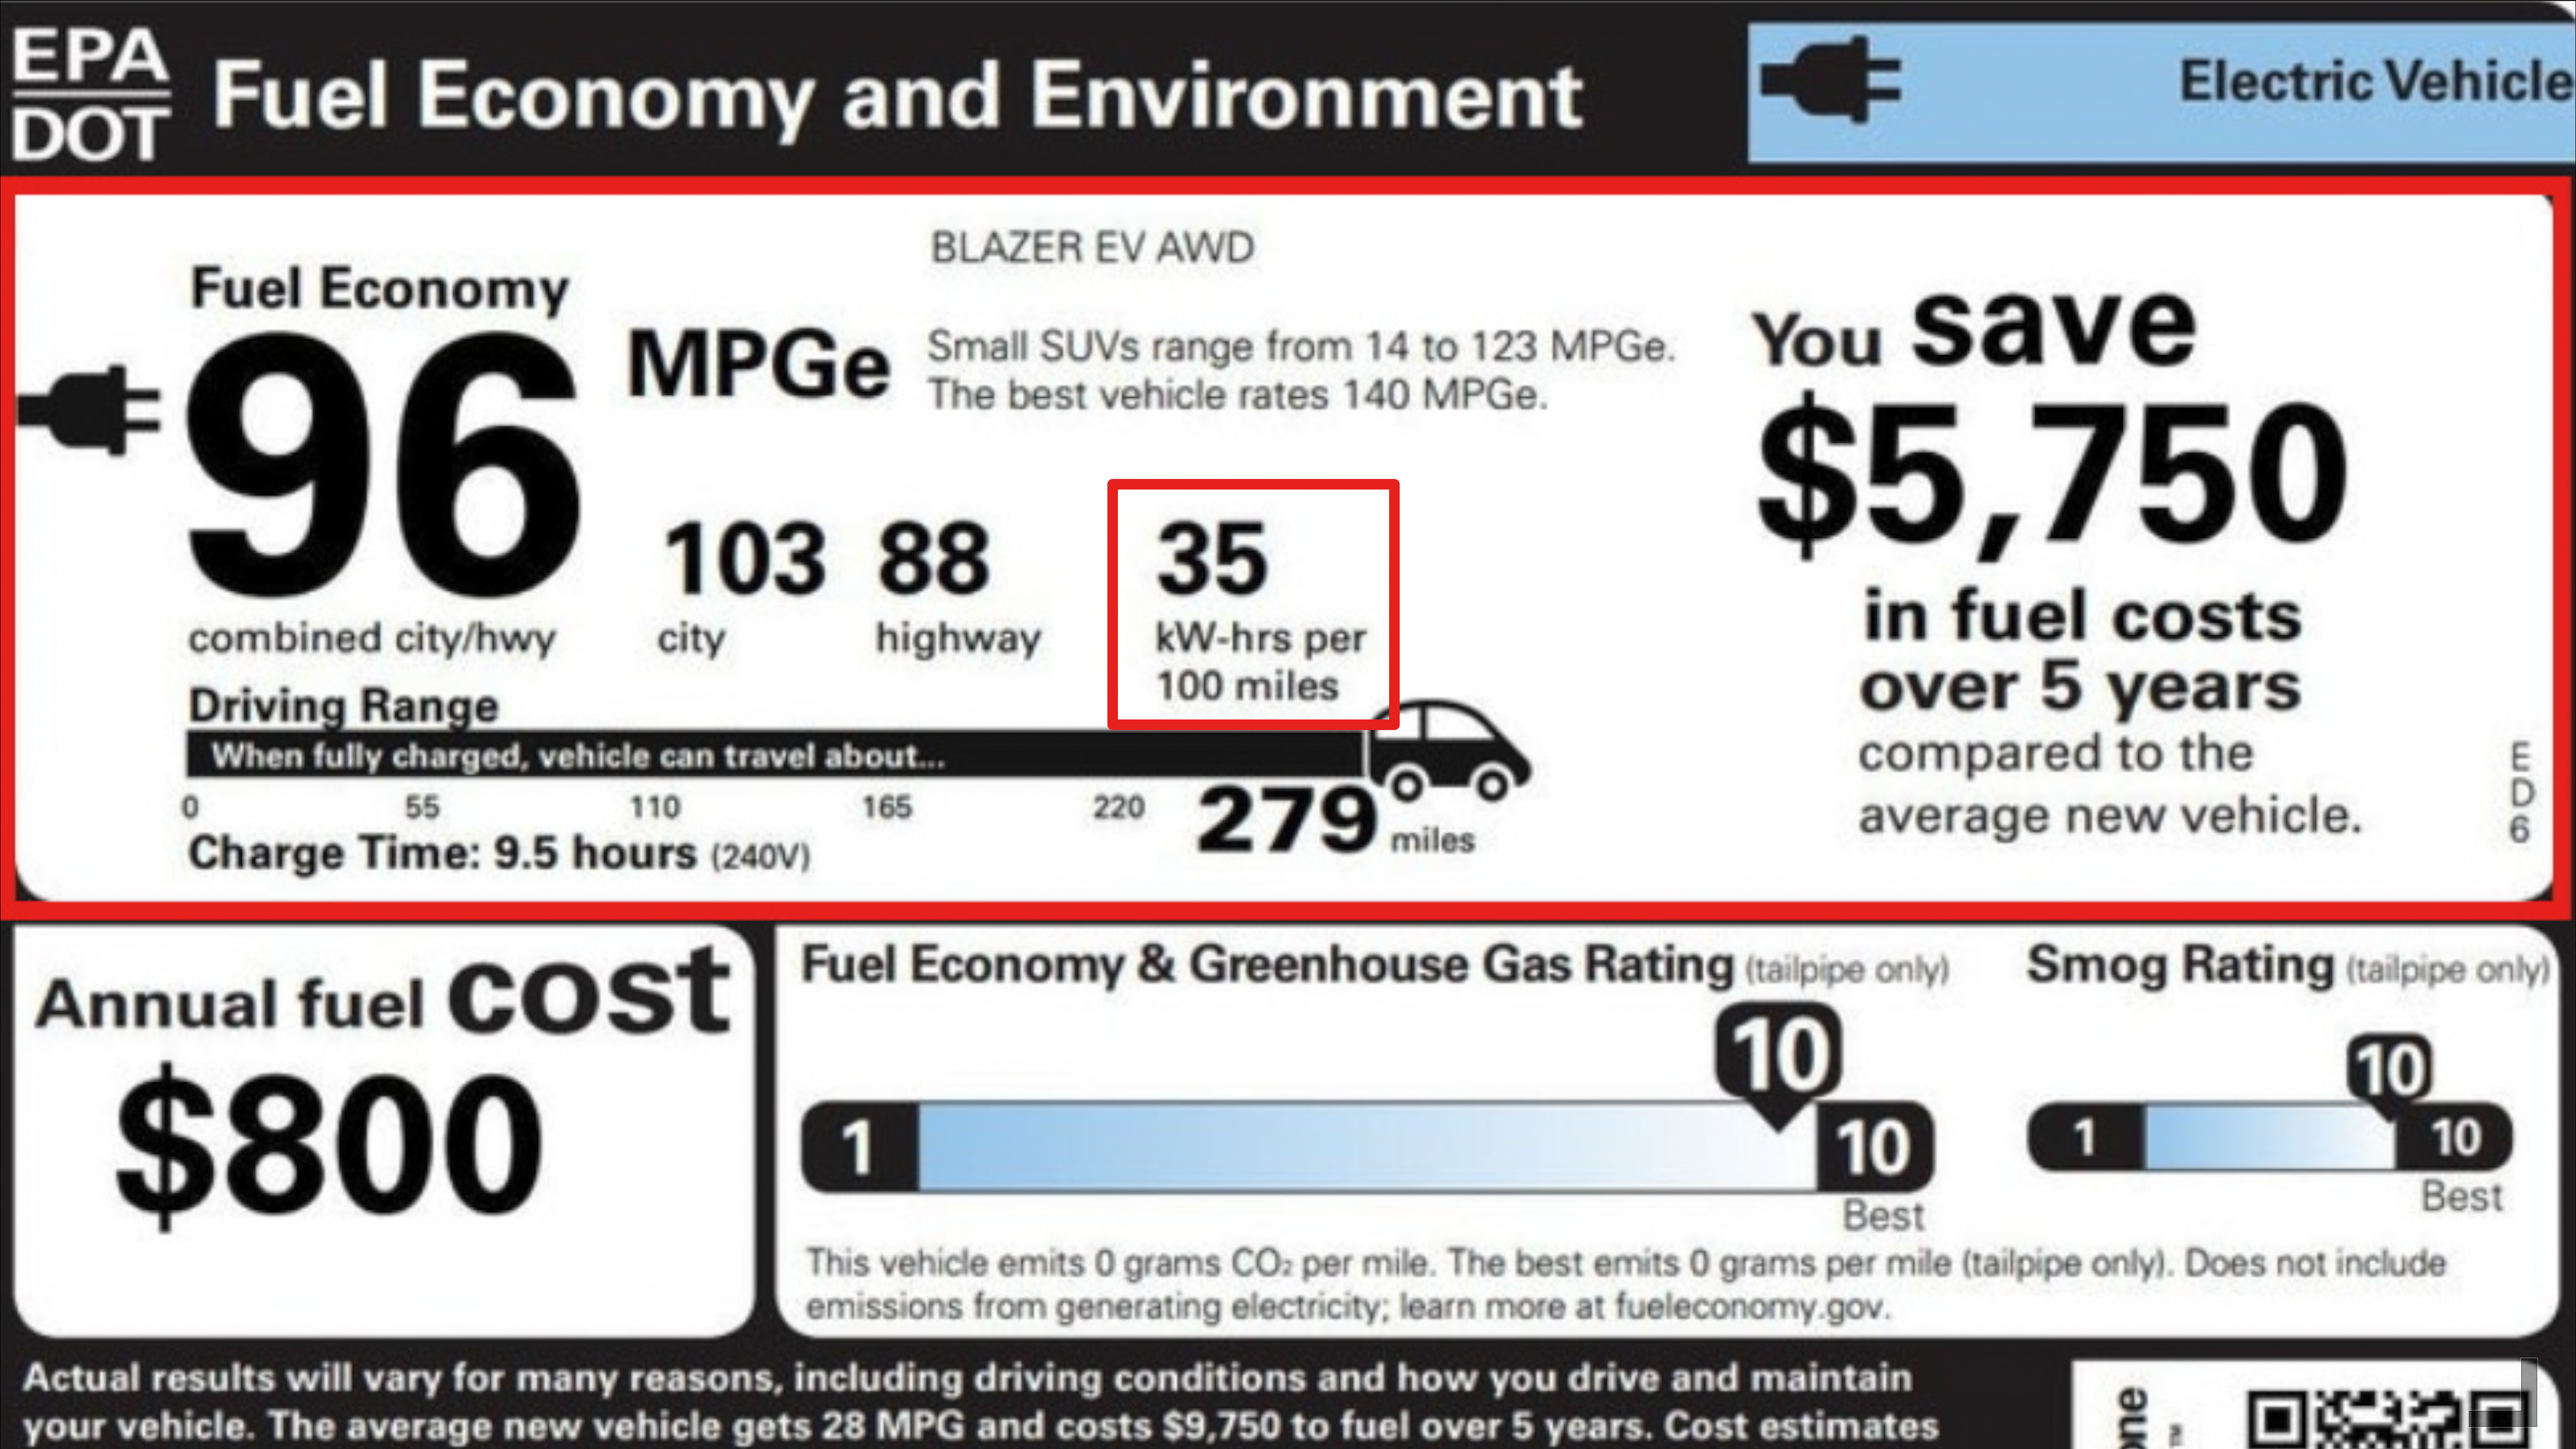
- the number of “kW-hrs per 100 miles” from the EPA section of any electric vehicle’s window sticker (see image above – in that image, the value is 35, and is in the red box)
- the cost you pay for a kWh of electricity at your home (or at public chargers) and
- the cost of a gallon of gasoline in your area.
- the MPG rating of a gasoline- or diesel-powered vehicle you wish to compare to the EV.
Once you enter those four values into the four yellow and blue cells, you will be shown how far each vehicle can travel on one dollar’s worth of “fuel.” These values are displayed in the red cells of the spreadsheet, in the bottom-right corner. This allows you to compare what really matters: the cost of driving down the road. The resultant MP$ for the EV is in the “Electricity” row’s right cell, in red. The internal combustion vehicle’s result is in the “Gasoline/Diesel” row’s right cell, in red.
Notice the left version of the spreadsheet has an MP$ of 20.4 miles for the EV versus 9.4 miles for the ICE vehicle. The right spreadsheet has an MP$ of 20.4 miles for the EV versus 5.1 miles for the ICE vehicle. The difference was the ICE vehicle and cost of its fuel. In both examples, the EV was a Chevy Blazer EV. In the left spreadsheet, the ICE vehicle was a sedan that was rated at 30 MPG and used regular gasoline. In the right spreadsheet, the ICE vehicle was a pickup that was rated at 19 MPG and used diesel.
That’s why a static, printed window sticker can’t tell the whole story.
You can download a your copy of this spreadsheet from my Dropbox. When the new browser tab opens, just select version you want and then click on the “Download” icon at the top-right of the DropBox browser window.
Enjoy!
*The PlugShare website has the price per kWh for many public chargers.